From the spirals in sunflowers to the vastness of galaxies, there’s a recurring numerical sequence that nature follows, known as the Fibonacci sequence. But what if we told you that this sequence also plays a pivotal role in the financial markets? Welcome to the fascinating world of Fibonacci trading.
What is the Fibonacci Sequence?
Before diving into the financial implications, let’s understand the Fibonacci sequence. It starts with the numbers 0 and 1. Each subsequent number is the sum of the two preceding ones. So, it goes:
0,1,1,2,3,5,8,13,21,34,…
0,1,1,2,3,5,8,13,21,34,…
This sequence is not just a mathematical marvel. It’s found in various natural phenomena, from the way leaves arrange themselves around a stem to the spiral of galaxies.
The Golden Ratio and Trading
Derived from the Fibonacci sequence is the ‘Golden Ratio’, denoted by the Greek letter ‘phi’ (ϕ). It’s approximately equal to 1.618. When you take any number in the Fibonacci sequence and divide it by its preceding number, as the numbers grow larger, the ratio tends to the Golden Ratio.
But how does this apply to trading?
Understanding Fibonacci Levels
In trading, Fibonacci levels are horizontal lines drawn on a price chart, indicating potential support and resistance levels. These levels are calculated by taking two extreme points (usually a peak and a trough) on a stock chart and dividing the vertical distance by key Fibonacci ratios.
The primary ratios used in trading are:
- 23.6%
- 38.2%
- 61.8%
- 78.6%
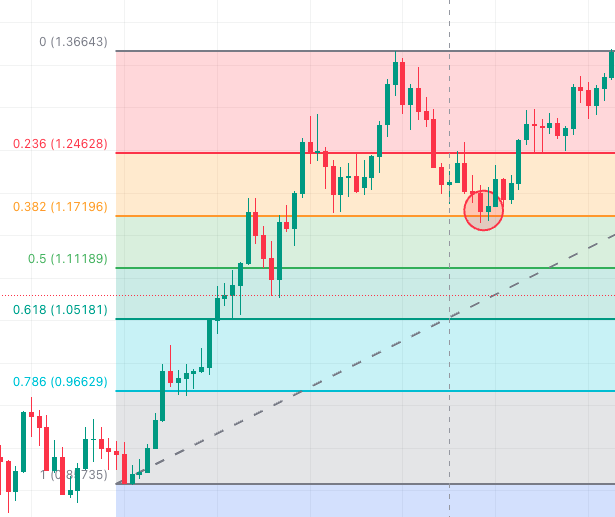
It’s worth noting that 50% is often included, even though it’s not a Fibonacci ratio, due to its significance in trading.
Harnessing Fibonacci Levels in Trading
- Identifying Trends: Before you start, it’s crucial to determine the prevailing trend. Fibonacci retracement levels work best when there’s a clear uptrend or downtrend.
- Drawing Fibonacci Retracements:
-
- For an uptrend: Start at a significant low point and draw the line to a significant high point.
- For a downtrend: Begin at a significant high and draw to a significant low.
- Making Entry Decisions:
-
- Buying: In an uptrend, look for a retracement to the 38.2% or 61.8% levels as a potential buy zone.
- Selling: In a downtrend, consider the same levels as potential sell zones.
- Setting Stop-Losses: It’s advisable to set a stop-loss order just below the next Fibonacci level. For instance, if you buy at the 38.2% retracement level, set your stop-loss just below the 50% level.
- Fibonacci Extensions: These help predict potential exit points. Once the asset starts moving in the desired direction, traders look at the 161.8% or 261.8% extension levels as potential profit-taking zones.
A Word of Caution
While Fibonacci retracement levels offer valuable insights, they shouldn’t be used in isolation. It’s essential to combine them with other technical indicators and tools to validate your trading decisions. Markets are influenced by various factors, and relying solely on one method can be risky.
In Conclusion
Fibonacci trading is a blend of art and science. It merges nature’s intrinsic patterns with the seemingly random world of financial markets. When used judiciously, it can offer traders a unique perspective, guiding them towards more informed trading decisions. Remember, like any tool, its effectiveness lies in the hands of its user. So, equip yourself with knowledge, practice, and trade wisely!
Join Finsai Academy(Hyperlink to – my.finsaitrade.com) and Learn Fibonacci Trading in detail.