Candlestick charts are among the most popular tools used by traders worldwide. Originating from Japan over 300 years ago, these charts have stood the test of time, providing traders with a visual representation of price movements. In this blog post, we’ll delve deep into the art of candlestick trading, shedding light on major patterns and how they can be used to make informed trading decisions.
Understanding the Basics
Each candlestick represents a specific time frame and shows the open, high, low, and close prices during that period. The thick part of the candlestick is called the ‘body’, while the thin lines above and below are ‘shadows’ or ‘wicks’.
- Bullish Candle: When the close price is above the open price, the candle is typically white or green.
- Bearish Candle: When the close price is below the open price, the candle is usually black or red.
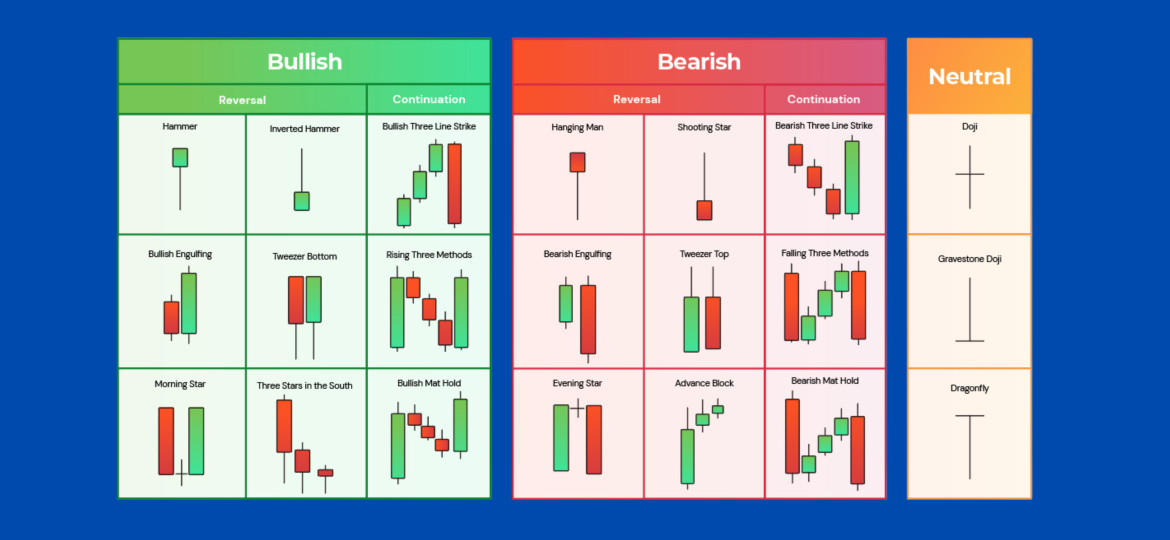
Major Candlestick Patterns
Let’s dive into some of the most significant candlestick patterns and understand their implications:
- Doji: Represents indecision in the market. It occurs when the open and close prices are virtually the same. The pattern indicates a potential trend reversal.
- Hammer and Hanging Man: Both have small bodies and long lower wicks. The hammer indicates a bullish reversal when seen after a downtrend. The hanging man, on the other hand, suggests a bearish reversal after an uptrend.
- Bullish and Bearish Engulfing: This is a two-candle pattern. The second candle ‘engulfs’ the first one. A bullish engulfing signals a potential upward movement, while a bearish engulfing hints at a downward trend.
- Morning Star and Evening Star: Both are three-candle patterns. The morning star signals the end of a downtrend, whereas the evening star indicates the end of an uptrend.
- Shooting Star: This pattern has a small body with a long upper wick, appearing after an uptrend. It signals a potential bearish reversal.
Trading with Candlestick Patterns
Identifying Entry and Exit Points:
- Entry: When you spot a candlestick pattern signaling a potential trend reversal, consider entering the trade at the opening of the next candle.
- Exit: Set a profit target based on resistance and support levels or other technical indicators. Additionally, always have a stop-loss in place to limit potential losses.
Combining with Other Indicators:
For increased accuracy, combine candlestick patterns with other technical analysis tools like moving averages, RSI, or Fibonacci levels. This can help confirm the validity of the patterns and increase the probability of successful trades.
Conclusion
Candlestick trading is like learning a new language. Once mastered, it offers traders a unique insight into market psychology and potential future price movements. But remember, no single tool or pattern guarantees success. It’s the combination of knowledge, practice, and risk management that paves the way for trading success.Join Finsai Academy(Hyperlink to – my.finsaitrade.com) and Learn Candlestick Trading in detail.