Introduction: The Language of the Markets
“Charts don’t lie, traders just don’t always speak their language.”
In the high-stakes world of online trading, every chart tells a story. And the chapters of that story? They’re written in candlesticks. These patterns don’t just depict price—they reveal intent, emotion, and momentum in the market. For new and experienced traders alike, mastering candlestick patterns is like learning to read a market’s mind.
At Finsai Trade, our advanced MT5 platform and mobile charting tools make it easy to identify these patterns in real time. Whether you’re trading forex, crypto, indices, or metals, recognising candlestick signals early can mean the difference between a timely trade and a missed opportunity.
Let’s explore the 10 most powerful candlestick patterns every trader should know in 2025.
What Is a Candlestick Pattern?
A candlestick pattern is a visual representation of price movement over a specific timeframe. Each candle captures four key points: the opening price, the highest price, the lowest price, and the closing price.
Candlesticks come in various shapes and colours, indicating whether buyers or sellers dominated that period. When several candles appear in a specific sequence, they form patterns that signal potential price direction, giving traders a heads-up on reversals or continuation trends.
1. Hammer
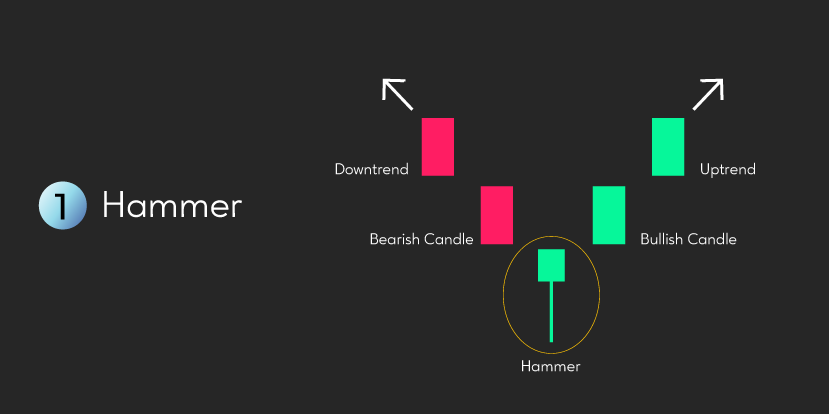
Type: Bullish Reversal
The hammer is one of the most recognisable bullish reversal signals. It features a small real body with a long lower wick and little to no upper wick. It indicates that sellers initially drove the price down, but buyers fought back, closing the candle near or above the open.
This pattern shows strong buying interest and often suggests the beginning of a new upward trend. Traders often look for hammers when the market has been falling and is near a support level.
Pro Tip: Confirm this signal with oscillators like RSI for stronger entry setups.
2. Inverted Hammer
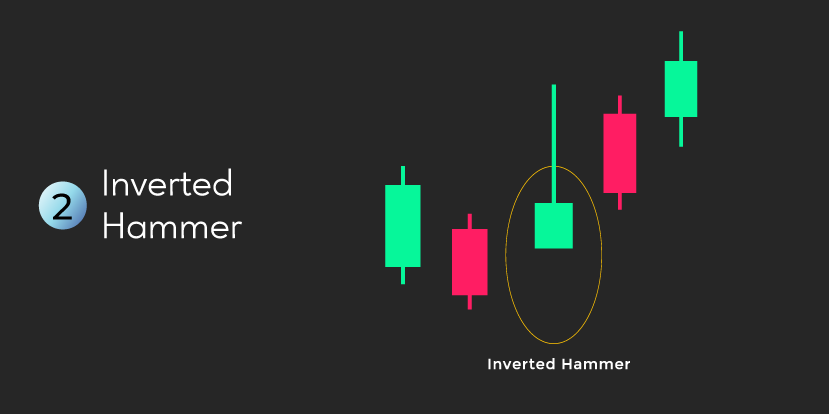
Type: Bullish Reversal
Visually opposite to the hammer, the inverted hammer has a small body and a long upper wick. It signals an attempt by buyers to push prices higher after a downtrend. While the day may still close slightly down, the wick shows increasing buying pressure and a potential trend reversal.
It’s a subtle sign that the momentum may shift, particularly when confirmed with increased volume.
3. Bullish Engulfing
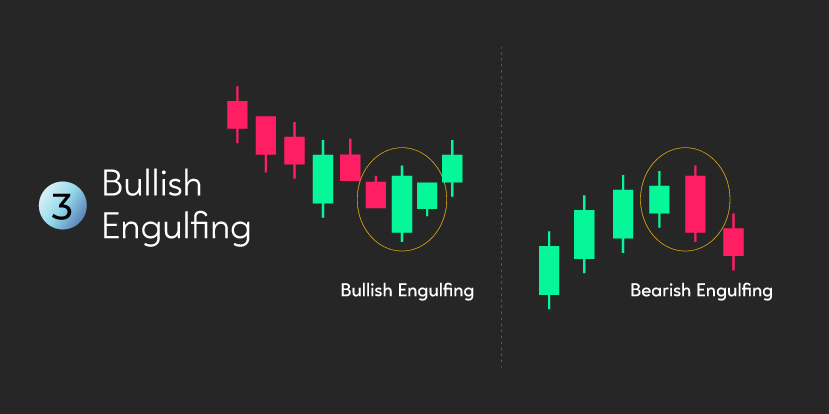
Type: Bullish Reversal
This two-candle pattern shows a small bearish candle followed by a larger bullish candle that completely engulfs the prior body. It reflects a powerful reversal in sentiment from sellers to buyers.
The bullish engulfing pattern is effective during a downtrend, indicating buyers are taking control and pushing prices upward.
On Finsai Trade, use this signal in tandem with moving averages to build high-conviction setups.
4. Piercing Line
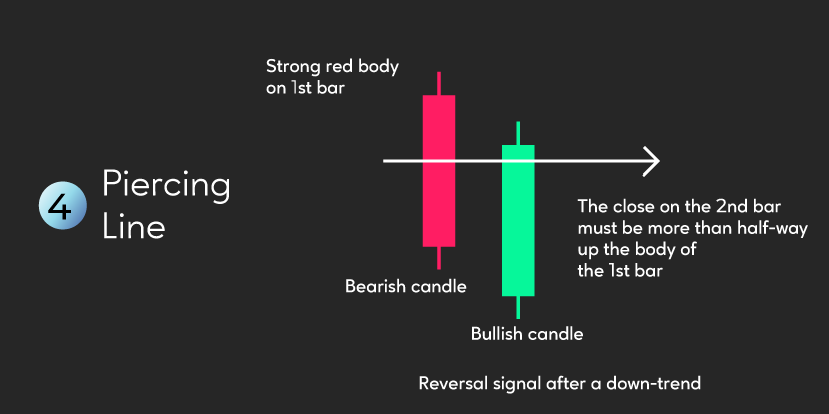
Type: Bullish Reversal
The piercing line appears after a decline, with a red candle followed by a green one that opens lower but closes above the midpoint of the previous candle. It tells traders that bears had an initial upper hand, but bulls came in mid-session with strength.
This pattern signals a strong potential reversal and is best used with confirmation from volume or a follow-up green candle.
5. Morning Star
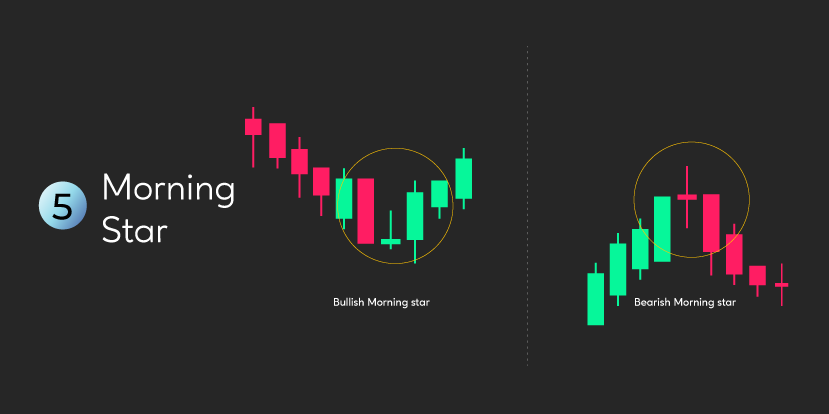
Type: Bullish Reversal
Structure: Three-candle pattern
This hopeful formation consists of a long red candle, a small-bodied candle (usually a doji or spinning top), and then a strong green candle. It represents a transition from bearish control to bullish interest.
The morning star pattern is a sign that downward momentum is stalling and a reversal may be underway.
Traders on Finsai can use this pattern in longer timeframes (4H, daily) to spot strong entry zones.
6. Hanging Man
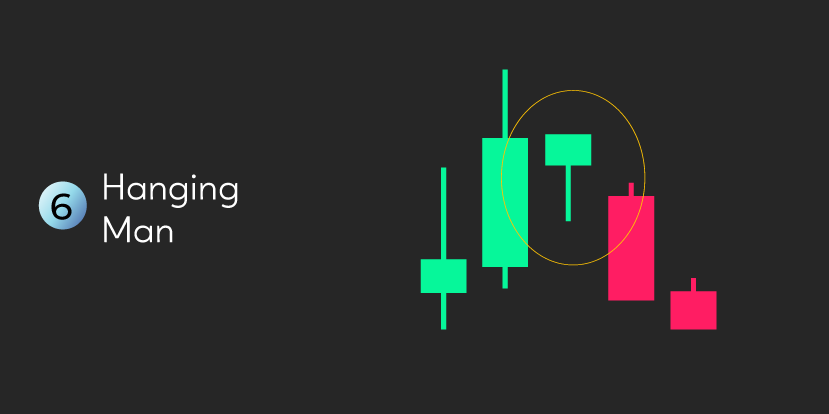
Type: Bearish Reversal
Much like a hammer, the hanging man has a small body and a long lower wick. But when it appears at the top of a rally, it spells caution. It signals that sellers entered the market aggressively, even though buyers managed to close near the open.
It warns that bullish momentum may be weakening—traders may want to tighten stops or prepare for a trend reversal.
7. Shooting Star
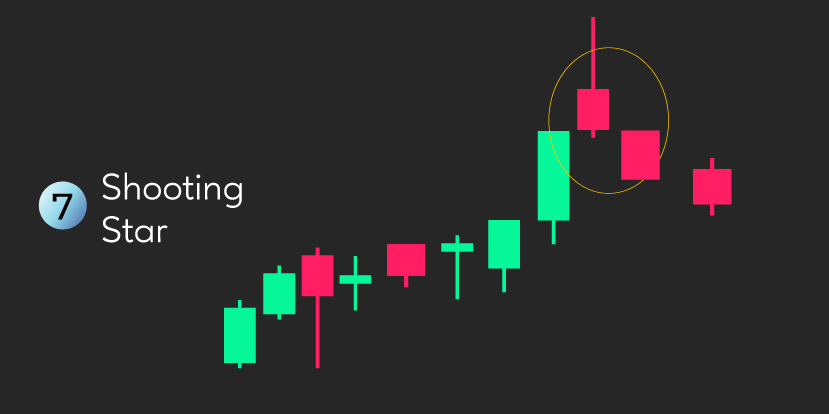
Type: Bearish Reversal
The shooting star is a candle with a small body and a long upper wick. It shows the market opened, surged, and then dropped back down near its opening price. This shift indicates fading buyer enthusiasm and growing seller presence.
Seen during uptrends, it can be a key signal for short opportunities.
8. Tweezer Bottom
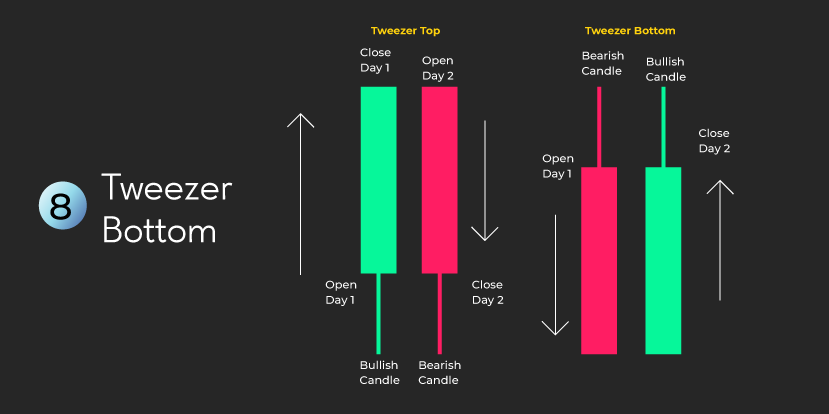
Type: Bullish Reversal
Tweezer bottoms are formed when two or more consecutive candles share the same low, usually appearing at the end of a downtrend. It suggests that sellers tried but failed multiple times to push prices lower, creating a firm support level.
Look for volume confirmation on Finsai’s MT5 charts before entering trades based on this signal.
9. Dark Cloud Cover
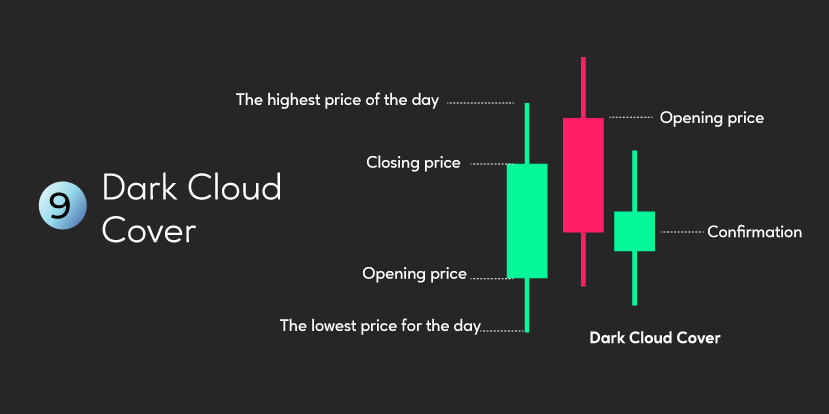
A two-candle pattern where a green candle is followed by a red one that opens higher but closes below the midpoint of the green one. It indicates that buyers drove prices higher, but sellers overwhelmed them by session end.
This pattern reflects a decisive shift in control and warns of potential downward movement.
10. Three Black Crows
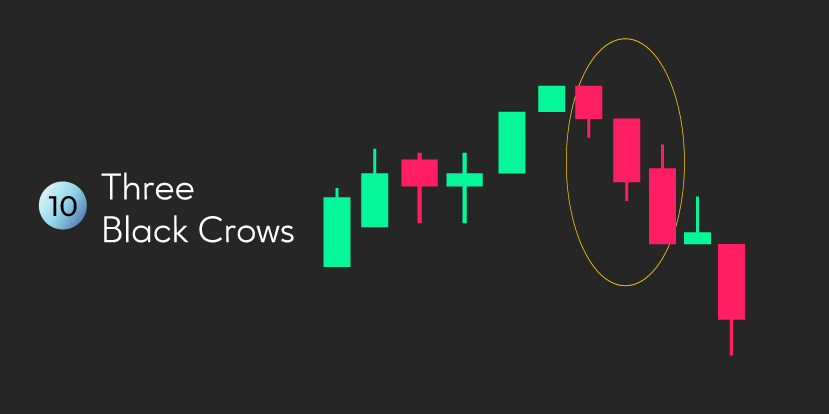
Type: Bearish Reversal
This aggressive pattern features three consecutive long red candles with lower closes and small or no wicks. It signals sustained selling pressure and a strong bearish reversal.
It’s typically seen after a bullish rally and marks the beginning of a potential downtrend.
Why Candlestick Patterns Still Matter in 2025
Even in a world driven by AI algorithms and auto-trading bots, the human insight behind candlestick analysis remains vital. Patterns like the hammer or engulfing candles reveal what algorithms can’t always explain, which is trader psychology.
Candlestick patterns are a cornerstone of technical analysis. They help retail traders act with more confidence, especially when paired with a secure and responsive platform like Finsai Trade.
Why Trade with Finsai Trade
Finsai Trade isn’t just another online trading platform—it’s a trader’s toolkit built for precision, speed, and security.
- Zero SWAP Fees: Maximise your trades without overnight charges.
- Tight Spreads & Low Commissions: Keep more of what you earn.
- Advanced MT5 Charting Tools: Spot patterns and trade on the go.
- Compliant: Trade with confidence.
- 24/7 Live Support: Your questions answered, anytime.
Special Offer: First Trade Risk-Free
- Sign up on the platform and verify your KYC.
- Deposit just $100
- Place your first trade.
- If you make a loss, then get up to 20% or $100 back as bonus credit.
- If you win, the profit is all yours.
There’s no better way to start trading than risk-free.
FAQs: Candlestick Patterns & Online Trading
What are candlestick patterns in trading?
They are visual cues based on price action that help traders anticipate market direction.
Are candlestick patterns good for beginners?
Absolutely. They’re intuitive, easy to learn, and provide valuable insights into price behaviour.
Can candlestick patterns predict price movements?
Not precisely. They hint at potential movements and should be used with other tools.
How can I learn to use these patterns?
Practice using a Finsai Trade demo account and test different strategies.
What timeframe is best for spotting patterns?
Daily and 4H charts tend to give more reliable signals than shorter ones.
Disclaimer
Trading forex, crypto, and other derivatives involves a high risk of loss and may not be suitable for all investors. This article is for educational purposes only and does not constitute financial advice.