Gold in H2 2026: Why Prices Fell and What CFD Traders Should Watch Now
Wondering why is gold price falling after record highs? Track crucial gold price H2 2026 trends, Fed pressure, and top CFD gold trading strategies H2 setups.

On this page
The financial landscape of 2026 has been nothing short of a rollercoaster for precious metals. To understand the current market layout, one must look at the staggering contrast defining this year: gold price today trades in the $4,390–$4,410 range, a substantial correction from the breathtaking, all-time high of roughly $5,600/oz slammed into the charts on January 28–29, 2026.
As we progress through the second half of the year, tracking the gold price H2 2026 trajectory requires looking past surface-level headlines. While many retail investors are panicking over the retreat from the peaks, experienced contract-for-difference (CFD) traders recognize that deep structural corrections generate premium swing volatility.
This deep-dive will break down the macroeconomic forces shaping the gold price outlook H2 2026 and outline actionable strategies for navigating the XAU/USD landscape.
Why is Gold Price Falling in 2026? The Macro Triggers
The dominant question circulating trading floors and search engines alike this quarter is straightforward: why is gold price falling despite persistent global fractures? The market has experienced a unique confluence of factors that altered the traditional safe-haven narrative, establishing distinct gold sell off triggers.
1. Fed Rate Pressure and the Real Yield Dilemma
The single heaviest anchor weighing on the precious metal throughout the first half of the year has been the Federal Reserve's stubborn monetary policy. Persistent inflation and strong macroeconomic indicators forced central banks to keep interest rates "higher for longer" than Wall Street initially modeled.
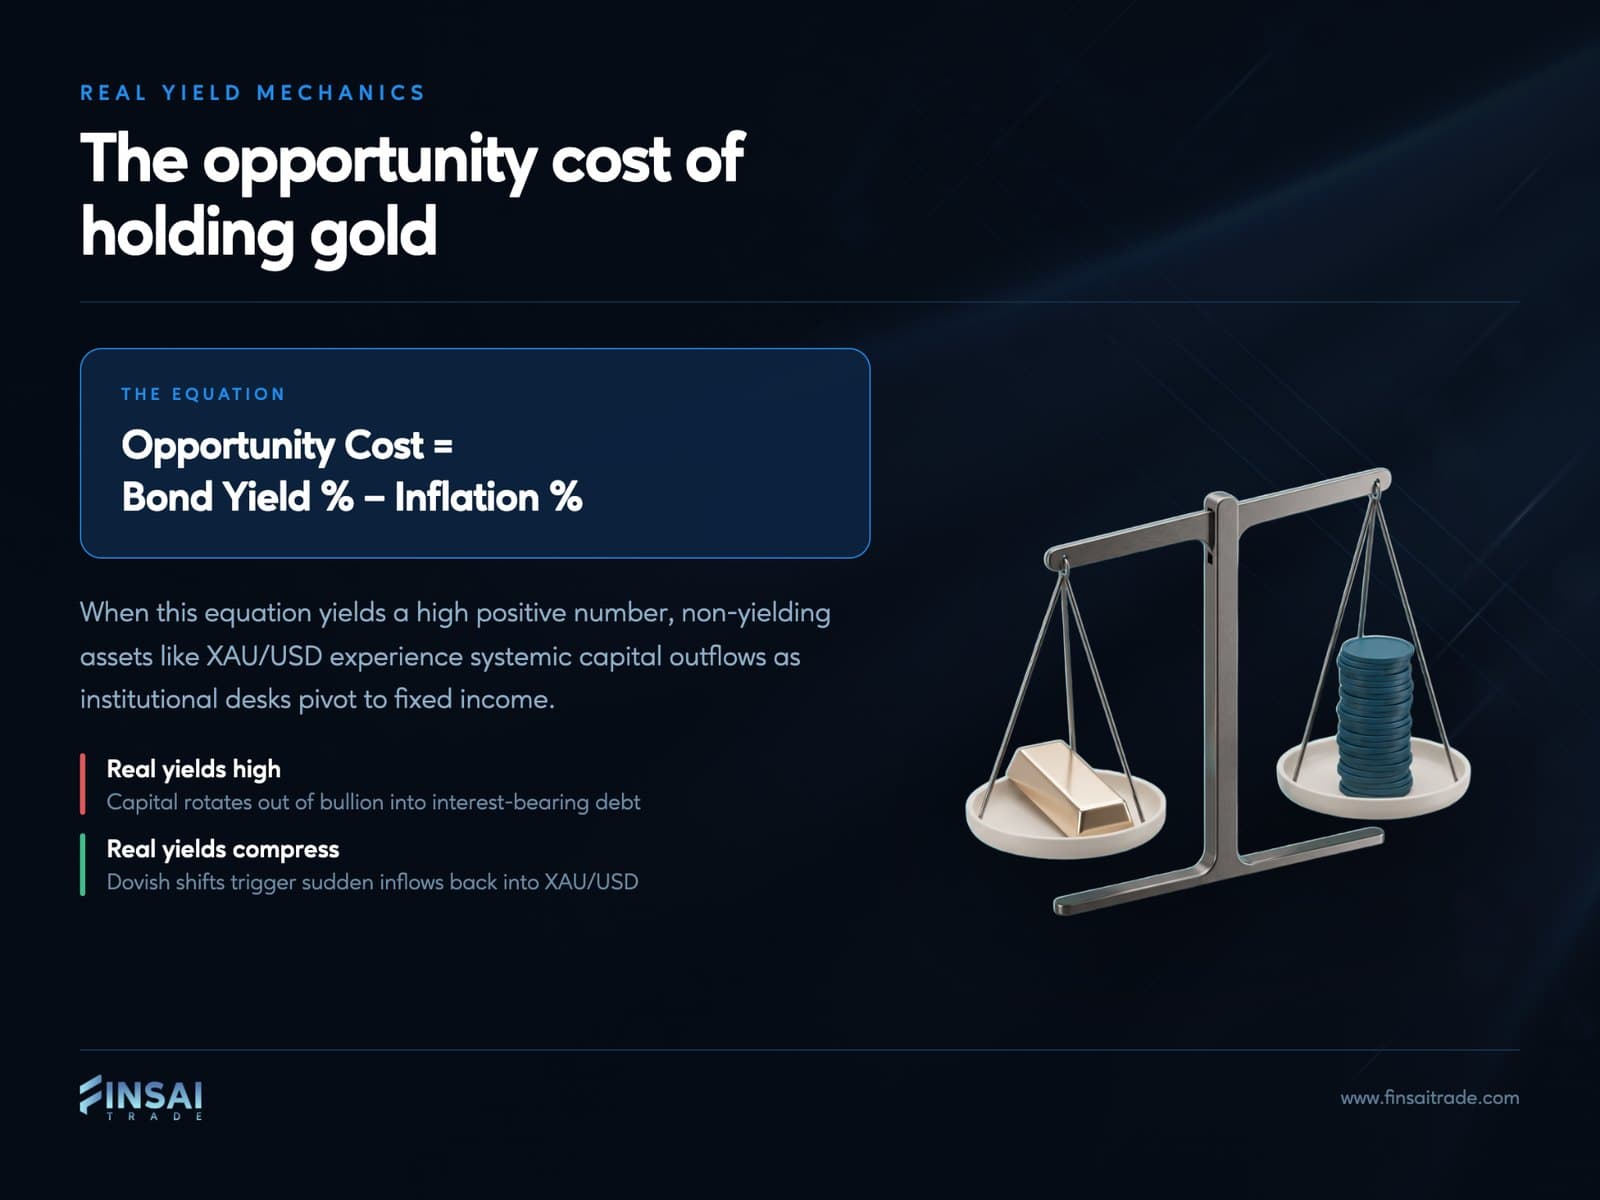
When analyzing how central bank rate decisions move gold prices, it boils down to the mechanics of real yield opportunity cost. Because gold is a non-yielding asset, its relative appeal softens when global government bond yields hover at multi-decade highs. Capital that would otherwise seek refuge in bullion has been heavily diverted into interest-bearing debt instruments. Any hawkish Fed rate pressure on gold shifts capital allocations instantly, amplifying the Fed rate hike gold price impact across institutional portfolios.
2. The Dominant Greenback (Gold vs Dollar 2026)
Because gold is priced internationally in greenbacks, the clearing price of XAU/USD is deeply tethered to the health of the American currency. The gold vs dollar 2026 dynamic has heavily favored the latter for most of the year. Driven by U.S. economic resilience, a consistently robust US dollar has made purchasing bullion significantly more expensive for foreign buyers using weaker currencies, naturally chilling global spot demand and accelerating the trend of the gold price falling 2026.
3. Institutional Capital Flipping: Gold ETF Outflows 2026
While physical retail demand in select regions remains steady, the institutional paper market tells a completely different story. We have witnessed substantial, consecutive gold ETF outflows 2026 as macro funds unwind the massive defensive positions they built up during the 2024–2025 bull run. This institutional liquidation has temporarily overwhelmed underlying gold safe heaven demand 2026, causing liquid asset managers to systematically trim their exposure to the metal.
XAUUSD Macro Analysis: When Will Gold Price Recover?
Despite the steep correction from January’s highs, the macro floor for bullion remains remarkably resilient. Traders asking when will gold price recover must understand that the market is not in a terminal freefall. In fact, gold hit a fresh two-month peak near $4,450 in early August 2026, sparked by a dovish U.S. Producer Price Index (PPI) reading that pulled the market’s expected odds of a September Fed rate hike down to roughly 35%.
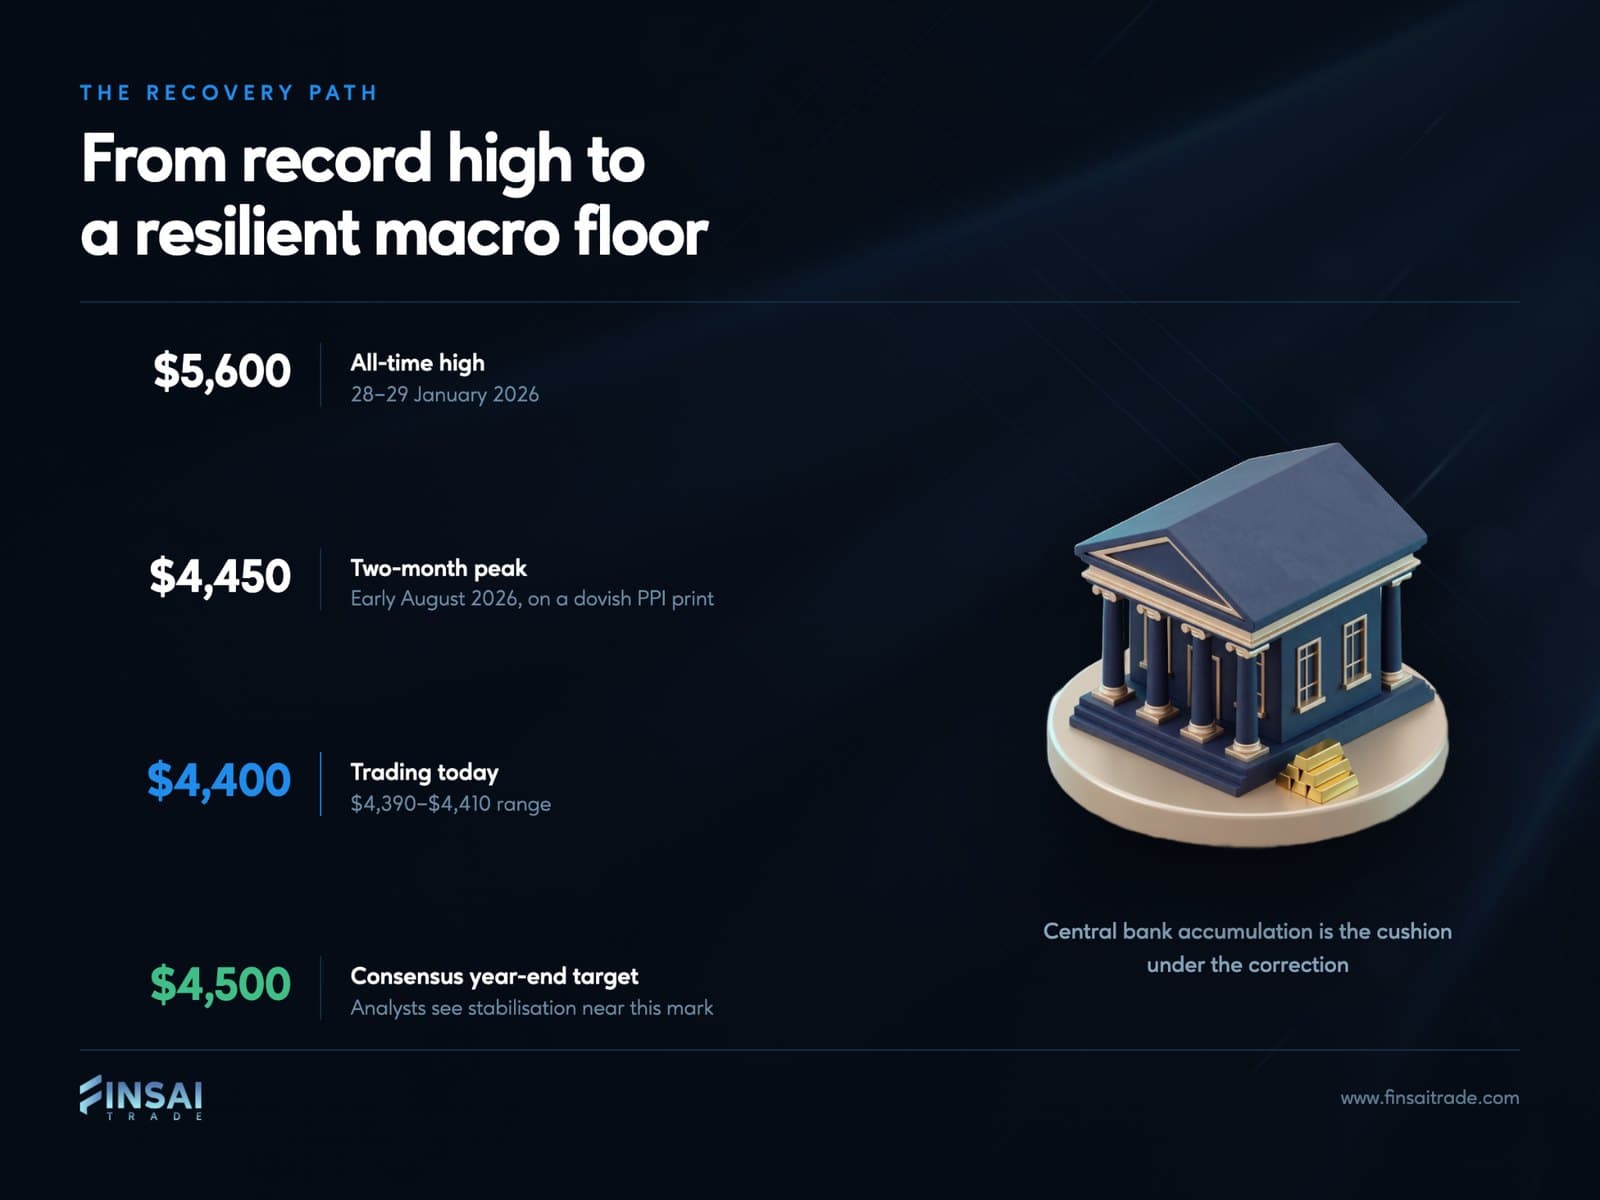
A vital pillar supporting the long-term structural gold price prediction is aggressive, unrelenting central bank gold buying 2026. Sovereign institutions, particularly across emerging markets, continue to diversify away from G7 fiat currencies to fortify their national reserves. This institutional buying provides a firm cushion under the market, preventing a complete collapse of the structure.
When conducting a comprehensive XAUUSD macro analysis, it is also worth monitoring the broader commodities complex, specifically gold vs silver H2 2026. Silver’s performance has been highly erratic due to industrial demand vulnerabilities under high-interest rates, validating why many conservative allocators still view gold as the superior play when determining if gold is a good investment 2026. Major institutional revisions back this up: while groups like HSBC and J.P. Morgan slightly lowered their expectations mid-year to adjust to macro realities, the consensus gold price forecast 2026 among major analysts still targets a comfortable year-end stabilization near the $4,500/oz mark.
Tactical Playbook: Gold Price Forecast for CFD Traders
For agile retail market participants, long-term multi-year forecasts matter far less than immediate liquidity and intra-week price swings. The structural volatility of H2 provides an incredibly fertile ground for deploying advanced gold price forecasts for CFD traders templates.
Critical Gold Support and Resistance Levels to Watch
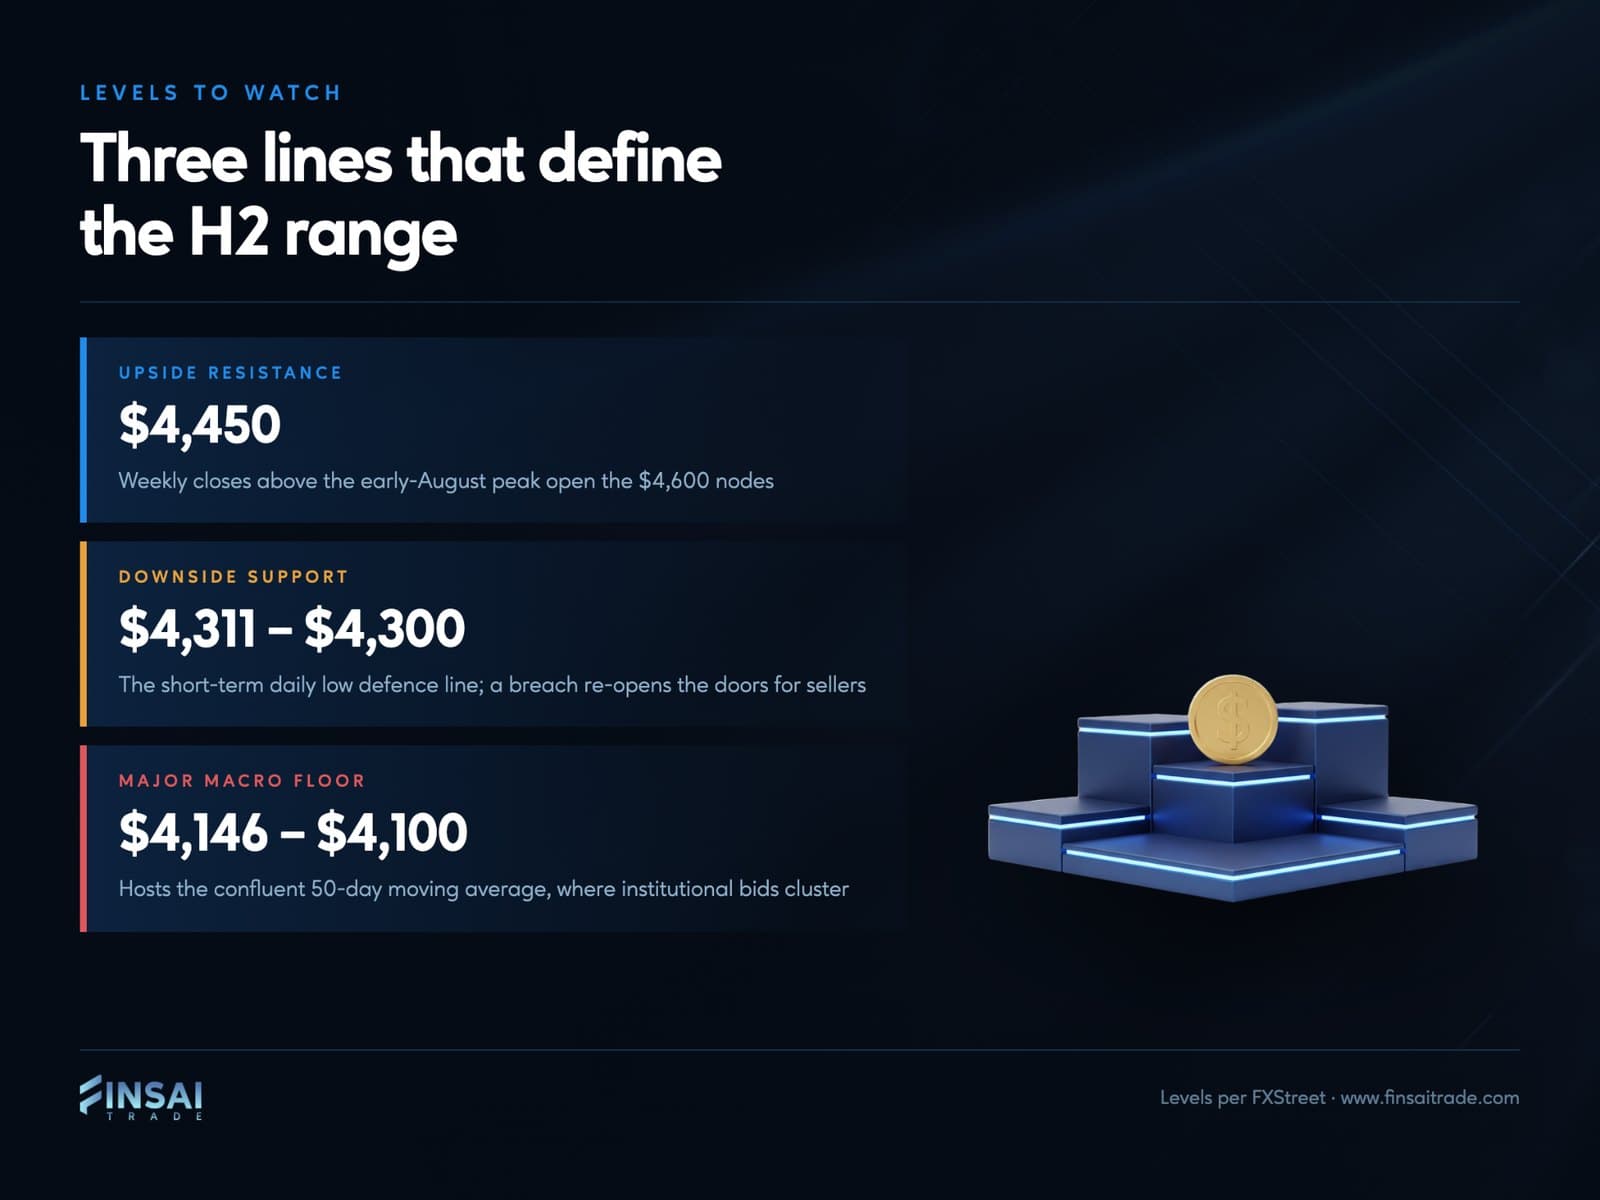
When setting up short-to-medium-term execution parameters, current technical indicators from FXStreet emphasize several key historical invalidation lines:
- Immediate Upside Resistance (~$4,450): The bulls must cleanly reclaim and close weekly candles above this early-August peak to signal a structural trend reversal back toward the $4,600 nodes.
- Immediate Downside Support (~$4,311 - $4,300): This region marks the recent short-term daily low defense line. A breach here re-opens the doors for short sellers.
- The Major Macro Floor ($4,146 - $4,100): This zone hosts the confluent 50-day moving average. If liquidations accelerate, institutional buy orders are highly clustered around this psychological floor.
To win consistently, your CFD gold trading strategies H2 should be grounded in short-term trend-following filters. Given that the current market landscape is highly responsive to macro data prints, traders should avoid marrying a single bias. Instead, use quantitative filters like tracking the VIX index or trailing Bollinger Band deviations to catch structural breakouts. Integrating algorithmic gold trading signals H2 2026 that track deviations in the US Dollar Index (DXY) can yield far more accurate entry precision than simple blind support buying.
Selecting Your Gateway: Regional Operational Execution
Whether you are a professional implementing strategies via localized gold trading UAE brokers capitalizing on Middle Eastern liquidity hubs, or an individual tracking the gold price outlook Mauritius traders use to hedge localized currency shifts, platform selection dictates execution quality.
In a fast-moving, news-driven market like XAU/USD, tiny slippages or widening spreads during high-impact data releases (like NFP or CPI) can completely decimate an otherwise perfect trading plan. Utilizing tier-one multi-regulated platforms ensures that your execution feeds remain stable, your margin requirements are protected by transparent risk-mitigation architecture, and your tactical execution stays sharp through the remainder of 2026.
Frequently Asked Questions
Why is gold price falling in 2026?
Gold prices are falling primarily due to the Federal Reserve keeping interest rates "higher for longer," which increases the opportunity cost of holding non-yielding bullion. This hawkish pressure, alongside massive institutional ETF outflows and a strong US dollar, has triggered a structural correction from January's historic peaks.
When will gold price recover?
Gold prices are projected to gradually recover and stabilize between $4,500 and $4,600 by the fourth quarter of 2026. Major financial institutions expect the price floor to hold firmly, driven primarily by historic, non-stop central bank accumulation and a structural global shift toward diversifying national reserves.
What are the critical gold support and resistance levels to watch right now?
The immediate upside resistance to watch is $4,450, while dynamic downside support sits near $4,300. If selling pressure accelerates, the ultimate macro target to monitor is the confluent 50-day moving average clustered between $4,100 and $4,146.
How do central bank rate decisions move gold prices in the CFD market?
Central bank rate hikes move gold prices downward by increasing the yield on government debt, which raises the opportunity cost of holding non-yielding bullion. Conversely, dovish shifts or surprise rate cuts lower bond yields, triggering sudden capital inflows into XAU/USD.
What are the best CFD gold trading strategies H2 has to offer?
The most effective CFD gold trading strategies for late 2026 rely on volatility-filtering and range-bound arbitrage rather than long-term directional bias. Deploying systematic trading indicators tied to the US Dollar Index allows traders to navigate macro-driven price swings.